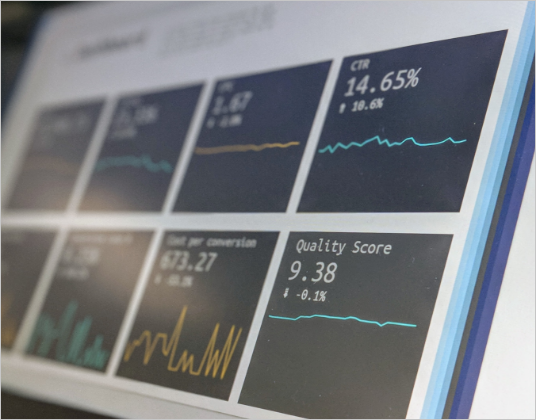
Data visualization is the science and art of leveraging data to communicate a business story. Inoesis Business Intelligence (BI) solutions Data visualization tool is now a must-have tool for gathering and evaluating information from datasets. In our business intelligence package, data visualization is a valuable tool. We assist organizations in better understanding their data and gaining useful insights from it, allowing them to make smarter choices that can improve operations and enhance profitability. Inoesis Data visualization tools include charts, graphs, as well maps may assist firms in more interactively visualizing their data. We allow you to recognize trends rapidly and act on them. Businesses can receive useful deep insights from Inoesis Data visualization technologies that would have been impossible to obtain through raw data alone. We provide customizable, configurable dashboards with advanced reporting and analytics features that can be accessed via any browser or platform. Inoesis emphasis on business intelligence creation helps you to identify crucial patterns, trends, and connections. Our team specializes in developing collaborative, self-service, and mobile-friendly interactive and real-time dashboards.
Technology Expertise
We are proficient in handling emerging technologies to help you build innovative enterprise-grade products and take your business to profitability 2x faster.